
Here's simple Bluetooth module HC-06. It is generally used for Arduino, but I'm going to use it on RPi, and send data to my laptop.
General explanations are posted on this website(http://blog.miguelgrinberg.com/post/a-cheap-bluetooth-serial-port-for-your-raspberry-pi/page/0). I used some contents I need from this post.

After connecting module and RPi like this figure, we need a few setup on RPi.
Type this command on terminal. sudo nano /boot/cmdline.txt
Fix the contents like this => dwc_otg.lpm_enable=0 console=tty1 root=/dev/mmcblk0p2 rootfstype=ext4 elevator=deadline rootwaitAlso Type this command on terminal. sudo nano /etc/inittab
Comment out the last line => #T0:23:respawn:/sbin/getty -L ttyAMA0 115200 vt100
Reboot the Raspberry Pi, then we're ready to use Bluetooth module as ttyAMA0 port. Then, I tested sending data from RPi to laptop. I used data from MPU6050 in this test.
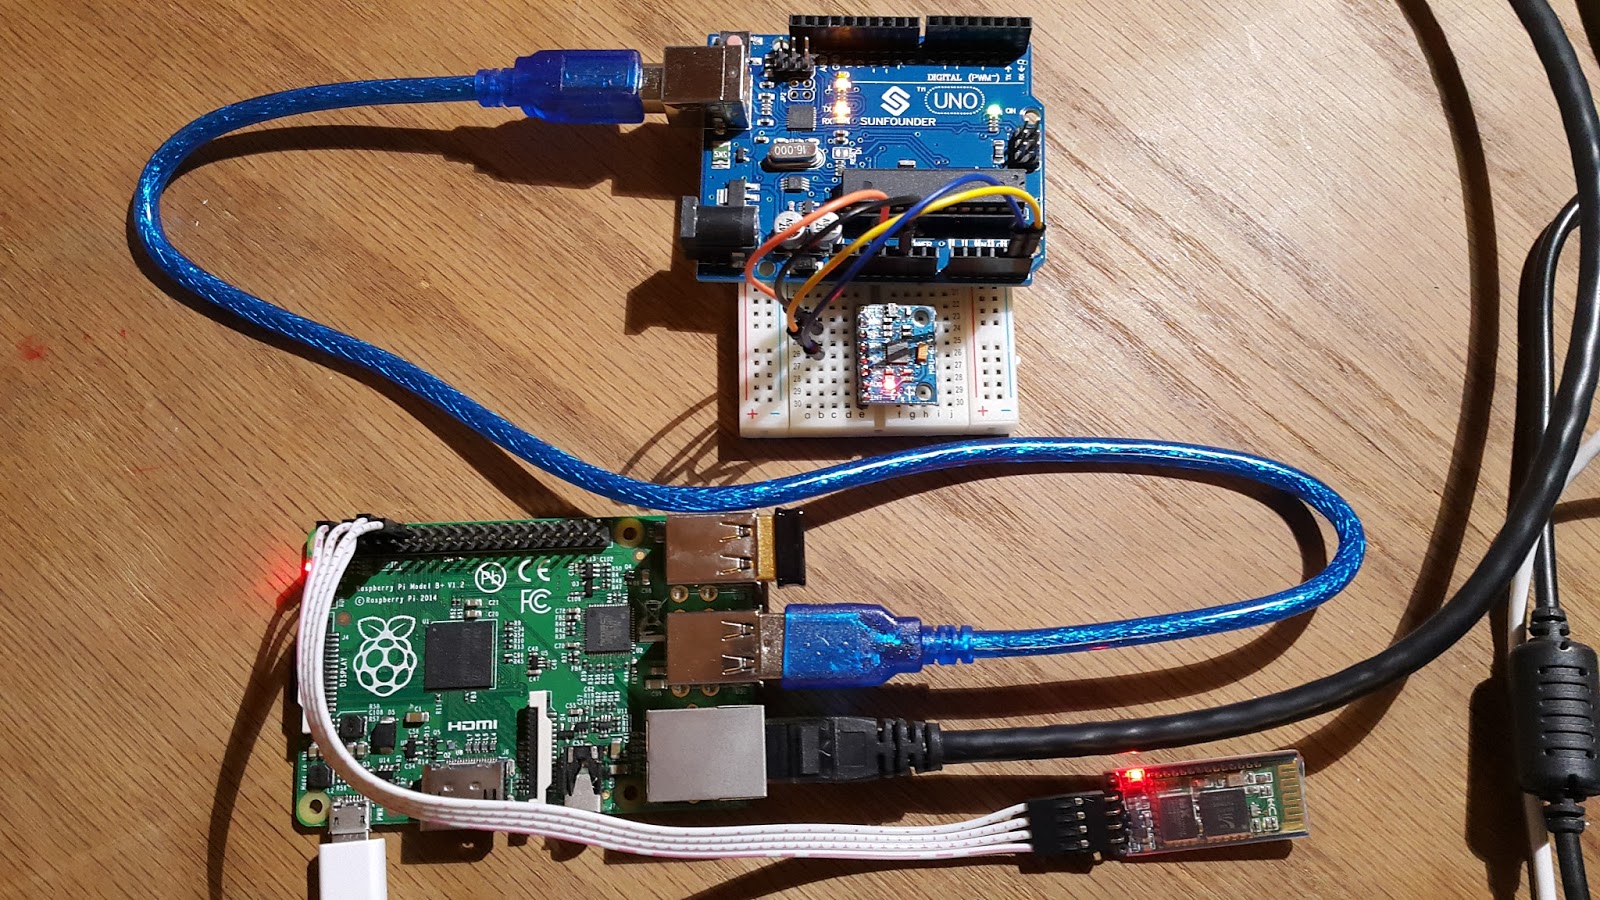
Here's design. Sensor data flow can be described like this.
Sensor(MPU6050) -> Arduino -> Raspberry Pi -> Laptop
I fixed some line of code that I used on RPi before.
import sys
import serial
port1 = "/dev/ttyACM0"
portout = "/dev/ttyAMA0"
serialFromArduino1 = serial.Serial(port1, 115200)
serialFromArduino1.flushInput()
serialToMATLAB = serial.Serial(portout, 9600)
serialToMATLAB.flushInput()
serialToMATLAB.flushOutput
def getSensorData1():
print('*MPU-6050*')
r_accel = serialFromArduino1.readline()
print(r_accel)
r_temp = serialFromArduino1.readline()
print(r_temp)
r_gyro = serialFromArduino1.readline()
print(r_gyro)
accel = r_accel.split()
temp = r_temp.split()
gyro = r_gyro.split()
acc_x, acc_y, acc_z = accel[2],accel[3],accel[4]
temp = temp[1]
gyro_x, gyro_y, gyro_z = gyro[2],gyro[3],gyro[4]
return(acc_x,acc_y,acc_z,temp,gyro_x,gyro_y,gyro_z)
def main():
print('starting...')
while True:
if(serialFromArduino1.inWaiting() > 0):
if(serialFromArduino1.readline().find('*') != -1 and serialFromArduino1.readline().find('=')!= -1):
acc_x,acc_y,acc_z,temp,gyro_x,gyro_y,gyro_z = getSensorData1()
print('Raw Data: ')
print(acc_x,acc_y,acc_z,temp,gyro_x,gyro_y,gyro_z)
print('\n')
serialToMATLAB.write('*\n')
serialToMATLAB.write(acc_x + '\n')
serialToMATLAB.write(acc_y + '\n')
serialToMATLAB.write(acc_z + '\n')
serialToMATLAB.write(temp+ '\n')
serialToMATLAB.write(gyro_x + '\n')
serialToMATLAB.write(gyro_y + '\n')
serialToMATLAB.write(gyro_z + '\n')
if __name__ == '__main__':
main()
clear all; clc; close all; s = Bluetooth('HC-06',1); fopen(s); time = 0; temp1 = 0; temp2 = 0; temp3 = 0; temp4 = 0; temp5 = 0; temp6 = 0; temp7 = 0; while(1) if(strtrim(fgets(s)) == '*') time = time+0.5; acc_x = str2double(strtrim(fgets(s))); acc_y = str2double(strtrim(fgets(s))); acc_z = str2double(strtrim(fgets(s))); temper = str2double(strtrim(fgets(s))); gyro_x = str2double(strtrim(fgets(s))); gyro_y = str2double(strtrim(fgets(s))); gyro_z = str2double(strtrim(fgets(s))); x=[time-0.5 time]; y1=[temp1 acc_x]; subplot(3,3,1); line(x,y1); y2=[temp2 acc_y]; subplot(3,3,2); line(x,y2); y3=[temp3 acc_z]; subplot(3,3,3); line(x,y3); y4=[temp4 temper]; subplot(3,3,4); line(x,y4); y5=[temp5 gyro_x]; subplot(3,3,5); line(x,y5); y6=[temp6 gyro_y]; subplot(3,3,6); line(x,y6); y7=[temp7 gyro_z]; subplot(3,3,7); line(x,y7); temp1 = acc_x; temp2 = acc_y; temp3 = acc_z; temp4 = temper; temp5 = gyro_x; temp6 = gyro_y; temp7 = gyro_z; hold on; drawnow; end end fclose(s);
I used same code on Arduino for MPU6050. Just changed sensing delay for convenience.

Result looks like this. It is graph of Accel(x,y,z), Temperature, Gyro(x,y,z).

This shows the result when I shake the sensor. Data includes 20 samples per second, so I arbitrary set the data capturing interval as 0.05 second in MATLAB. Maybe I can use some functions related to date or time in python to make more accurate real-time plotting.
댓글 없음:
댓글 쓰기